Cyclometric
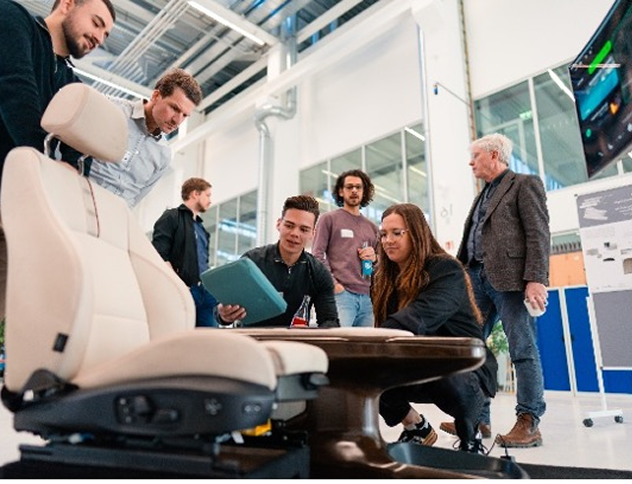
Cyclometric – Model-Based Decision Support for Proactive, Lifecycle-Oriented Vehicle Development Today’s carmakers must design components that are not only smart but circular. Yet engineers struggle with the sheer complexity of lifecycle data and sustainability targets. At Fraunhofer IAO i co-facilitated a series of multidisciplinary workshops I uncovered where developers lose time and insight when they try to judge recyclability, CO₂ and cost at once. Focusing on the vehicle’s centre console as a benchmark part, I translated those findings into a clear, data-driven screen UI and a redesigned set of “CycloP” process diagrams.The result enables engineers to see instantly how every design tweak affects reuse, CO₂ and cost—and was showcased as a highlight demonstrator at Hannover Messe 2025.
STRATEGY
Our business aim was to make circular decisions as quick and transparent as conventional cost cuts. Success therefore hinged on three indicators: the time an engineer needed to create a new console model inside Capella, the number of circular scenarios compared per session and the subjective confidence users felt when presenting results to management. My personal target was to reduce modelling time by roughly a third while keeping perceived effort low enough that three OEMs would request pilot projects.
RESEARCH INSIGHTS
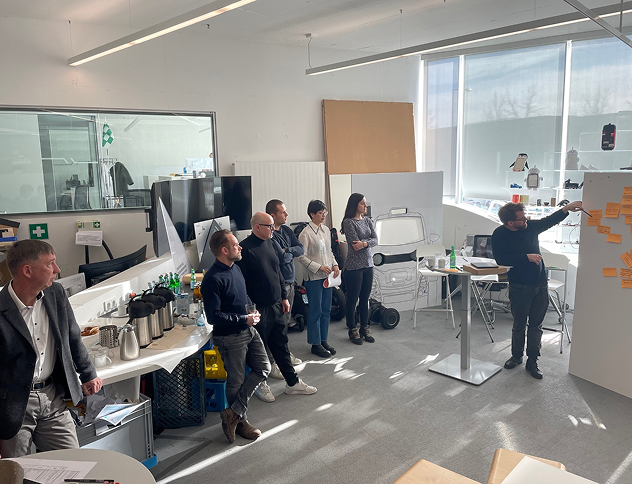
I planned and ran cross-partner workshops, led a competitive tool audit and interviewed experts from suppliers, recyclers and the German Automotive Industry Association. These activities confirmed that engineers trust sustainability metrics only when they are embedded in their native MBSE workflow; that colour-coded, lifecycle-specific process diagrams accelerate comprehension; and that the modular centre console is an excellent benchmark because its plastic-metal mix yields high gains from reuse and refurbishment strategies
APPROACH
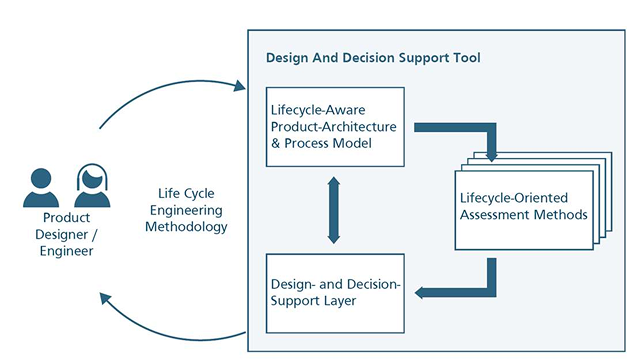
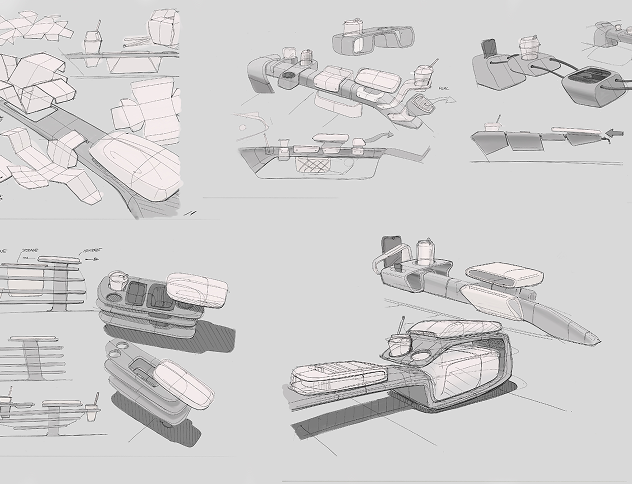
After clustering workshop data I mapped user goals to lifecycle entities and drafted wire flows. Weekly feedback rounds with domain specialists steered my iterations from low-fidelity sketches to an interactive Figma prototype. In parallel I rebuilt the CycloP diagrams, simplifying node structures and applying an accessibility-tested palette so that complex loops remain readable on the in-car screen.
DESIGN
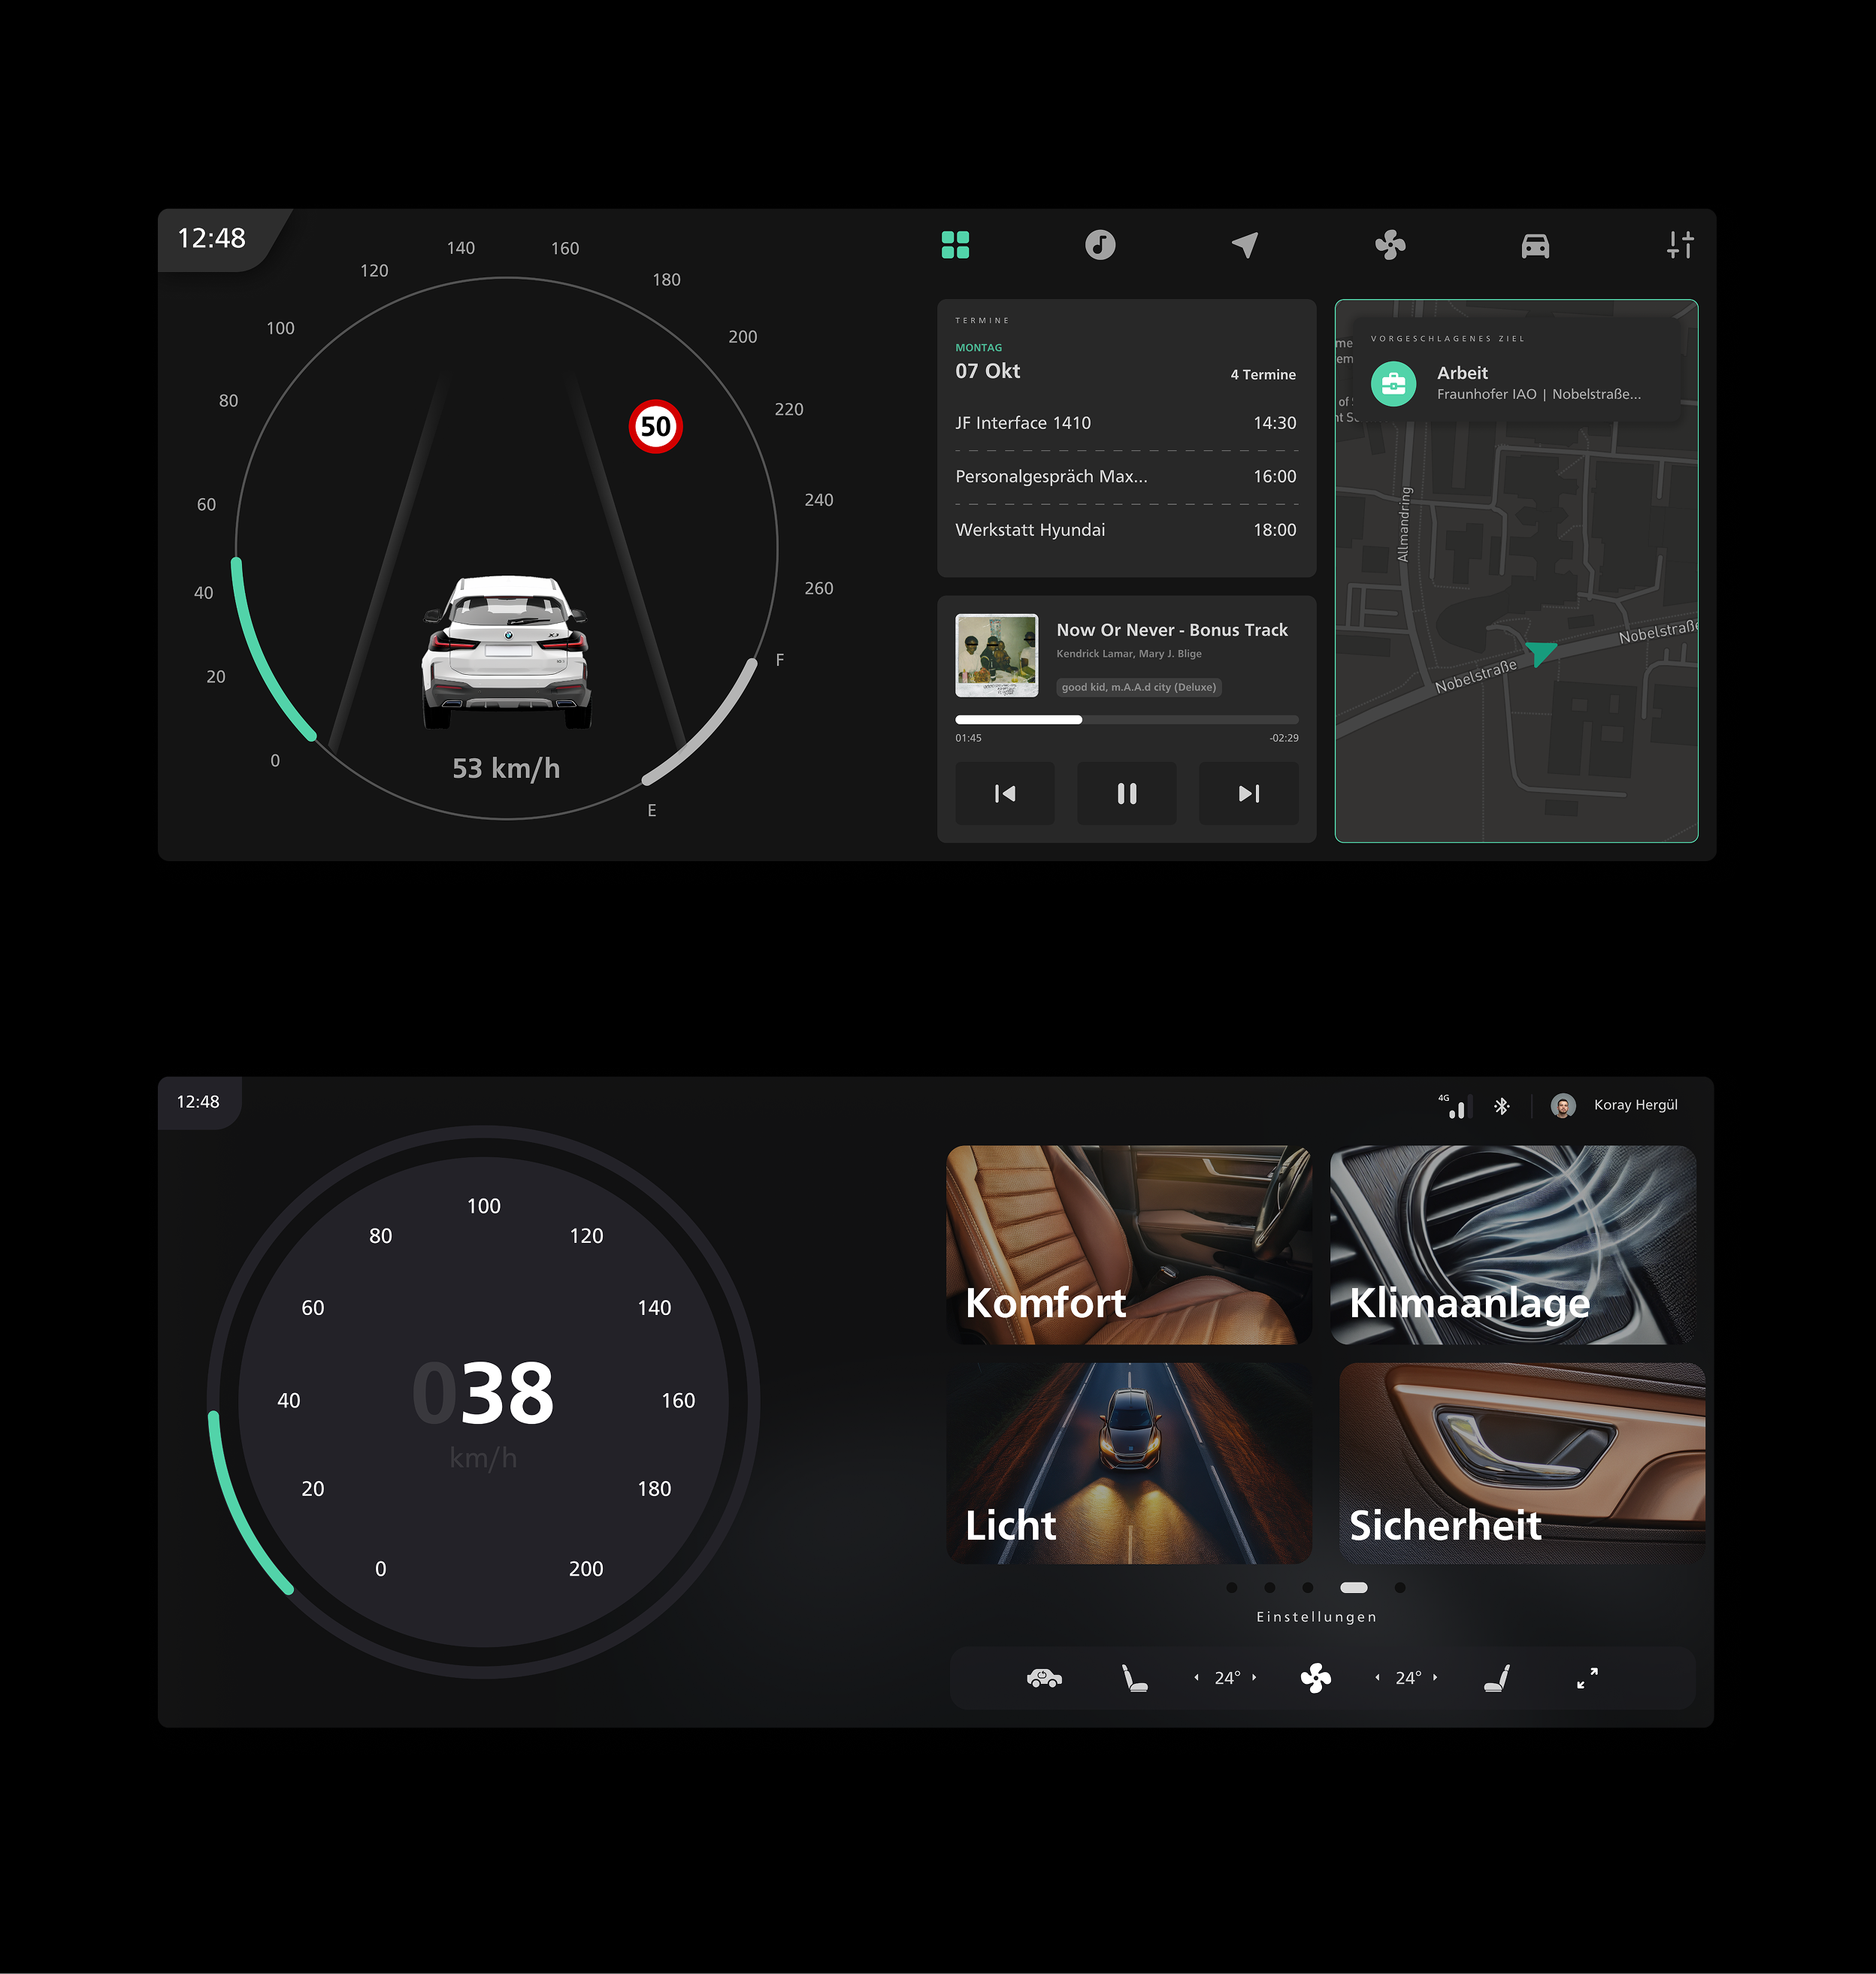
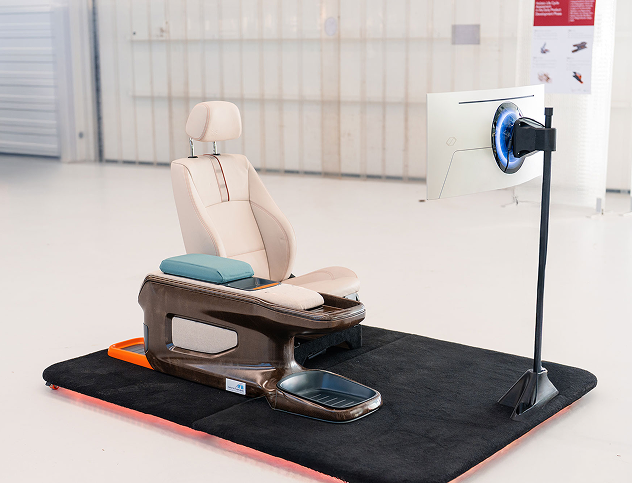
The final interface merges a KPI dashboard, drill-down process diagrams and a scenario picker into one cohesive workspace. To make it feel “car-native” I paired the UI with a concise touch-pad gesture set: two-finger swipes switch main tiles, single-finger flicks scroll lists, circular strokes raise or lower values and a press confirms choices. In hallway tests engineers could create and compare five console variants in about two-thirds of the former time, while the colour-coded diagrams made trade-offs clear enough for a System Usability Scale score of 82. The same demonstrator survived a full trade-fair week without a single interaction error, reinforcing the robustness of both UI and gesture language.
LEARNINGS
Cyclometric now cuts modelling effort by roughly twenty-eight percent and has secured memoranda of understanding with three OEMs for pilot integrations. For me the key lesson is that circularity becomes tangible only when data, visuals and haptics form a seamless narrative; clear diagrams and an intuitive gesture pattern can build as much trust as the underlying metrics themselves.